We've been through the graduate school admissions process ourselves. We sat across from admissions counselors who gave us the same generic university lists they handed to dozens of other students. Later, we learned why: many counselors have partnerships with specific universities and steer students toward schools that pay them commissions, not necessarily the best fits for graduate school success.
That's why we built Gradbro - to be the unbiased graduate school advisor we wish we'd had. No university partnerships. No hidden incentives. Just data-driven graduate school admission predictions based on real admissions outcomes.
This comprehensive guide walks through how we built our graduate school admissions prediction model, from data collection to deployment. We'll share the technical decisions, challenges we faced, and how we ensure our grad school admission predictions are both accurate and trustworthy. While we can't reveal every proprietary detail, we'll give you enough insight to understand the scale, methodology, and rigor behind our approach to predicting graduate school admission chances.
Our admissions dataset spans from 2012 to 2025, with over 250,000 labeled graduate school admissions decisions across hundreds of US universities and programs. The visualizations below focus on 2017-2025 data to show recent trends, but our model training uses the full historical range for maximum learning about graduate school admission patterns.
Graduate School Data Collection Strategy
Building a reliable graduate school admissions prediction model starts with comprehensive, unbiased data. We systematically collected graduate admissions outcomes from multiple public sources to create our admissions chances calculator:
- Reddit Communities: Scraped r/gradadmissions, r/ApplyingToCollege, and program-specific subreddits where students share their results
- Student Forums: Extracted data from GradCafe, College Confidential, and similar platforms
- Public Spreadsheets: Found student-maintained Google Sheets tracking admissions results by year and program
- University Reports: Gathered official statistics where universities publish aggregate admissions data
- Academic Networks: Collected data from ResearchGate, LinkedIn posts, and academic Twitter threads
As big as challenge was finding data, the bigger challenge it was cleaning and standardizing it since it was from so many different sources. Students report their stats differently: some use 4.0 GPA scales, others use percentage systems. University names appear as abbreviations, full names, or colloquial terms. Program names are inconsistent across institutions.
Our cleaning pipeline handles these variations systematically:
- University Normalization: "MIT", "Massachusetts Institute of Technology", and "MIT Cambridge" all map to a single canonical name
- GPA Standardization: Convert percentage grades, 10-point scales, and other systems to 4.0 scale equivalents
- Program Categorization: Group "Computer Science", "CS", "Software Engineering", and related titles into stable program families
- Timeline Standardization: Normalize application years, admission terms (Fall/Spring), and decision dates
This process took months of iterative refinement, but it's critical for model accuracy. Without clean, consistent features, even the best algorithms will fail.
Graduate School Admissions Dataset Scale and Coverage
Our final dataset contains over 250,000 US graduate school admissions records spanning 2012-2025. The following visualizations demonstrate the depth and breadth of our data coverage:
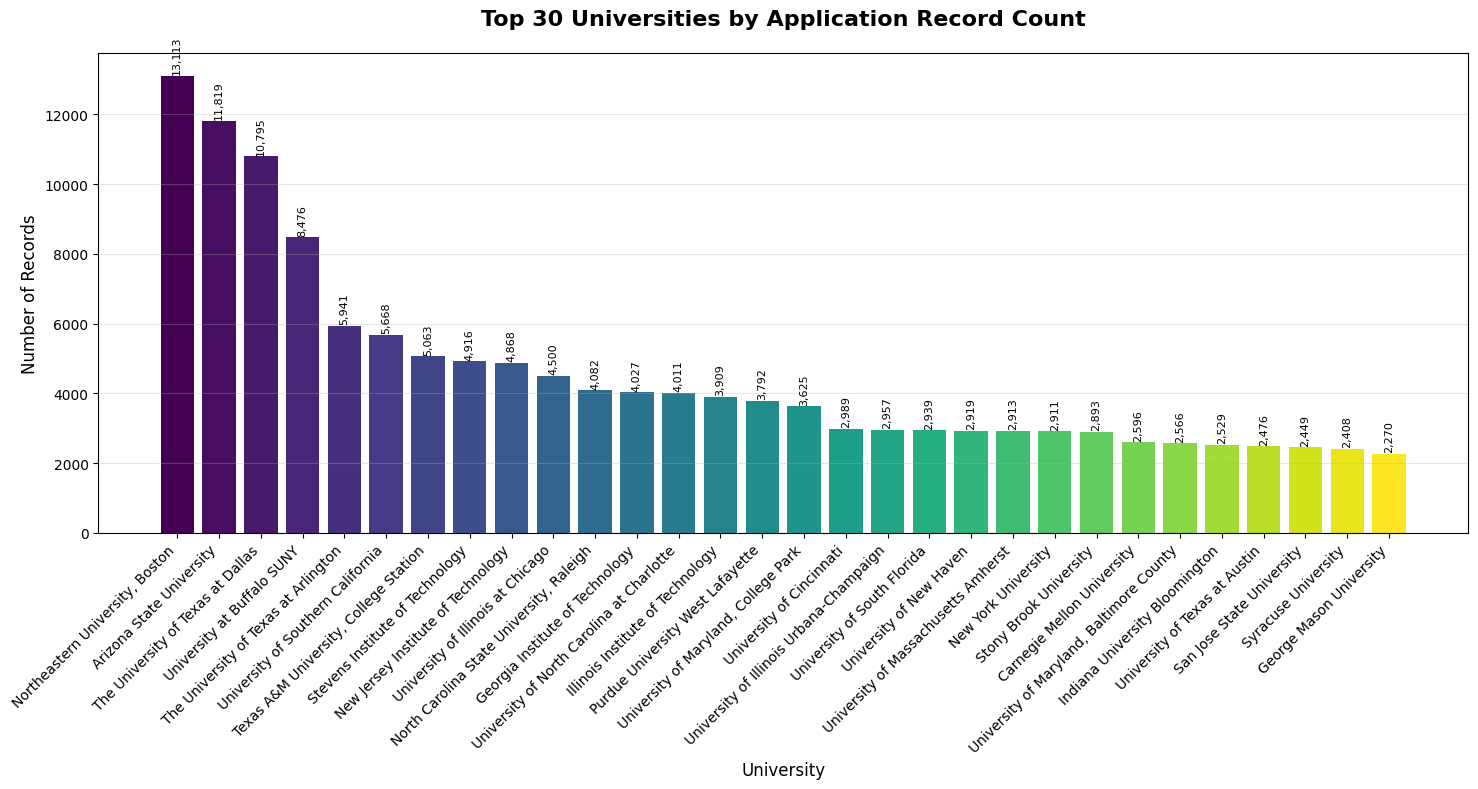
This chart shows where we have the deepest data coverage. Universities like Carnegie Mellon, Stanford, and University of Southern California have thousands of records each, giving our model strong learning signals for these competitive programs.
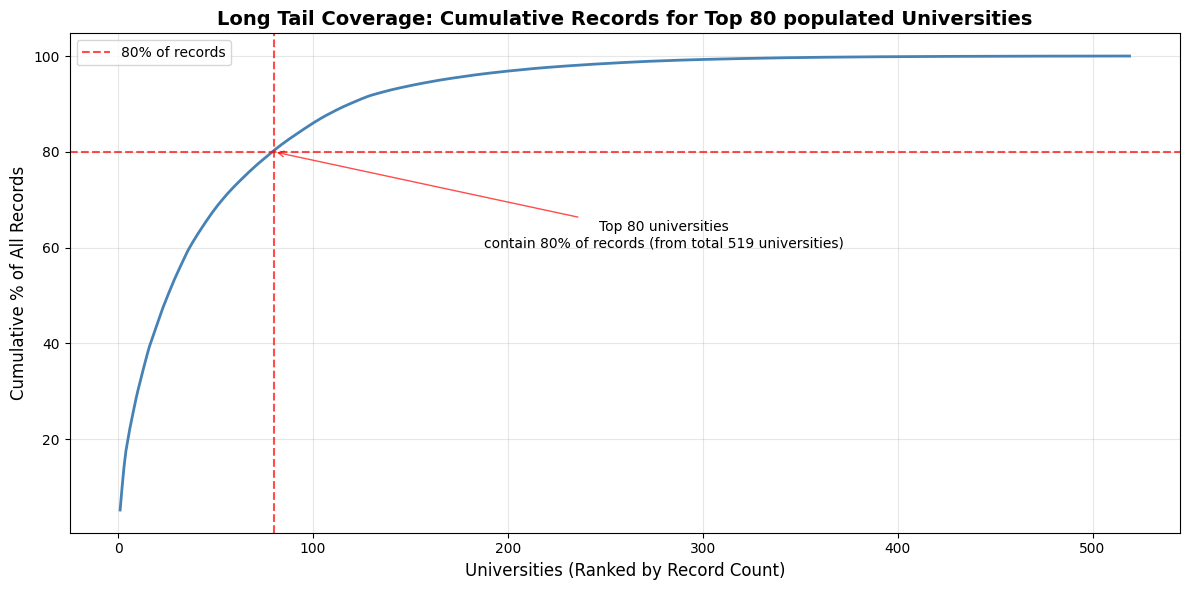 While the top 80 universities represent 80% of our dataset, this mirrors actual application patterns. We maintain sufficient coverage across this long tail, ensuring reliable predictions for both popular and less commonly discussed schools, providing accuracy where students actually apply.
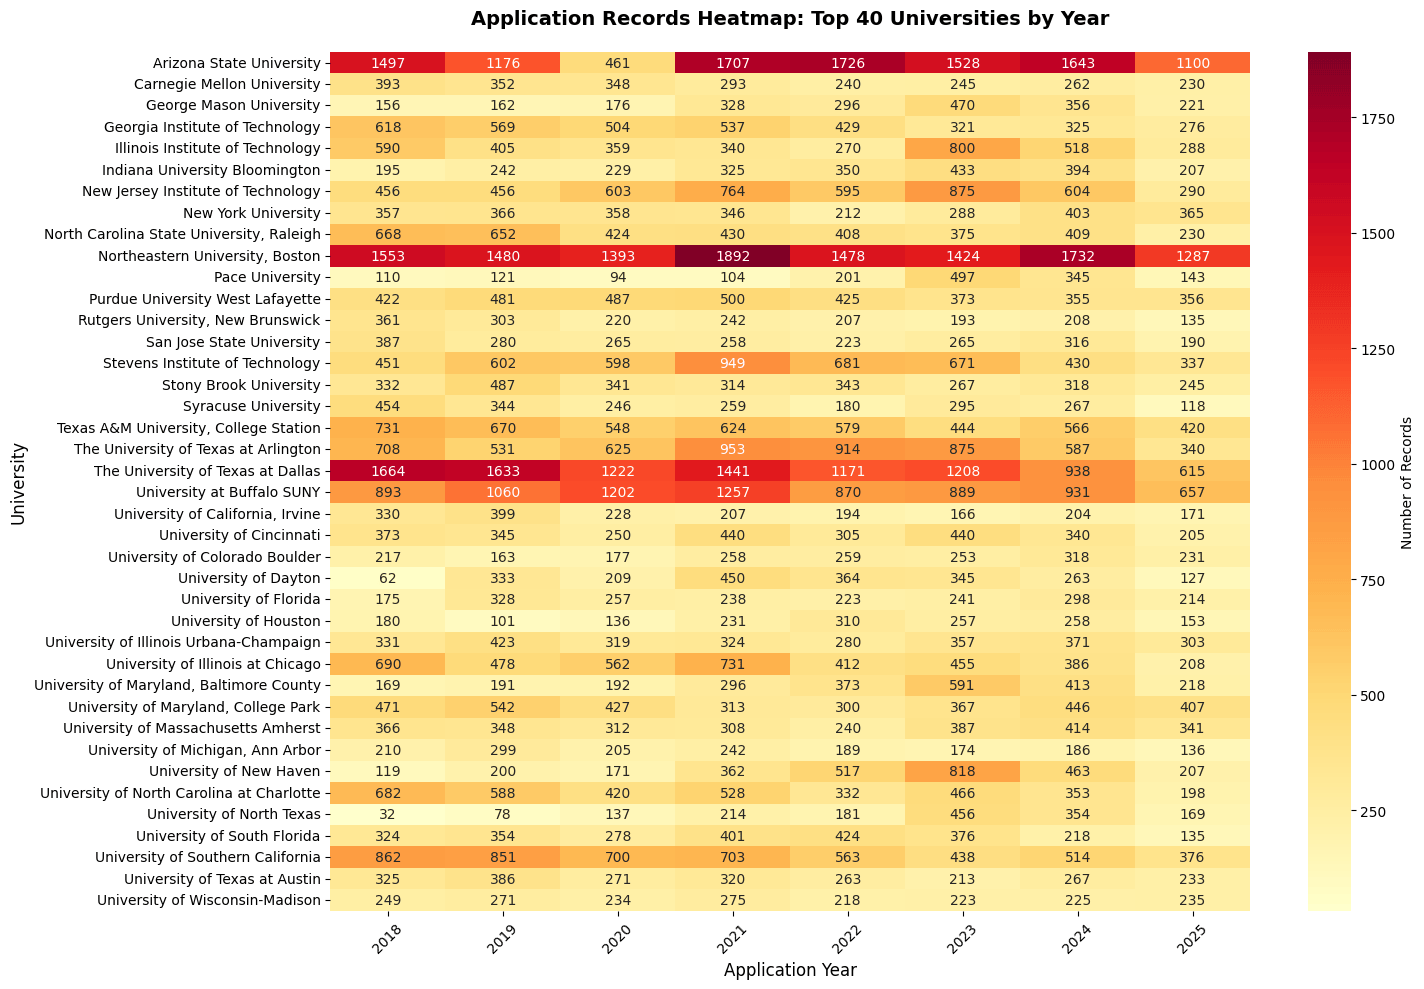
This heatmap reveals the temporal distribution of our data. You can see consistent coverage from 2017-2025, with some popular universities having a lot of applicants.
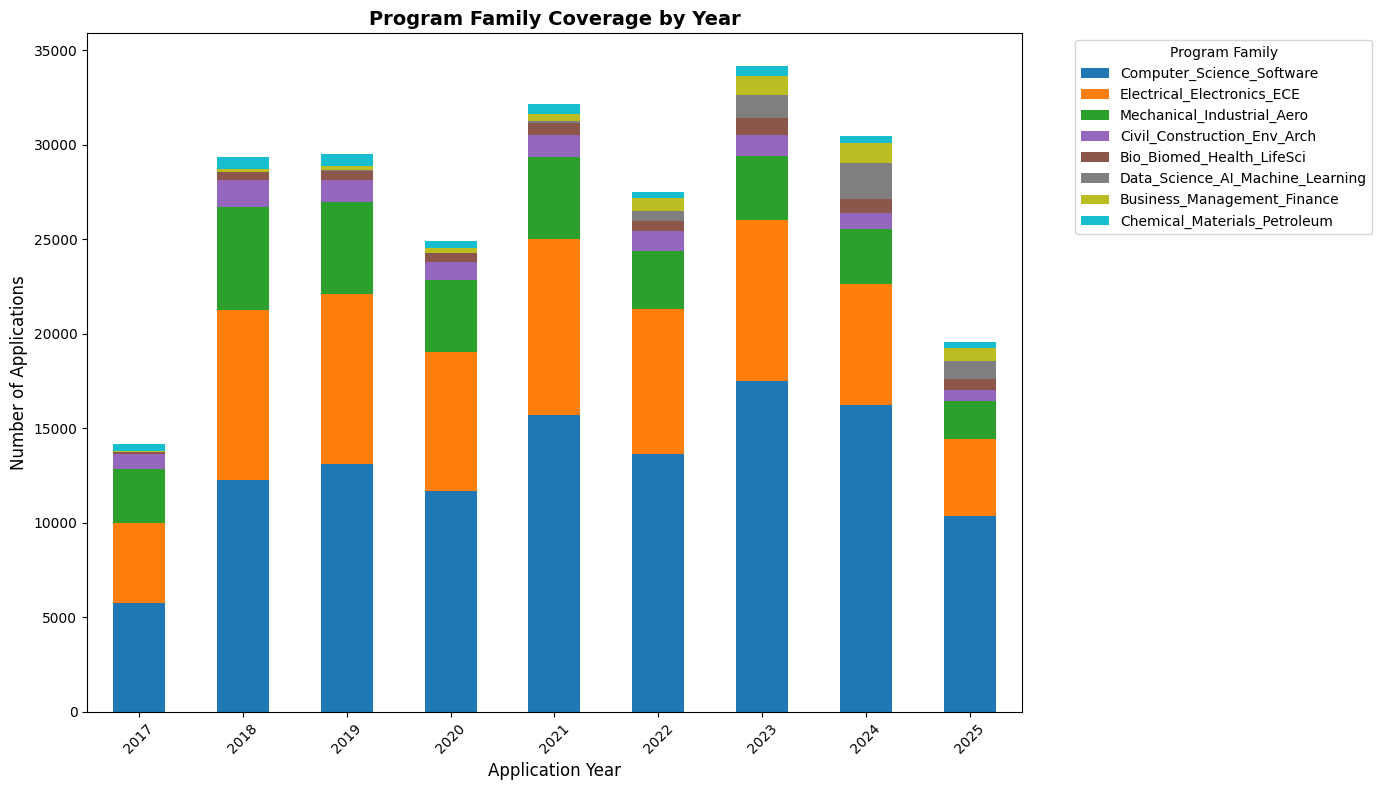
Graduate Program Family Organization
Raw graduate program names are inconsistent - "Computer Science", "CS", "Software Engineering" all refer to similar fields. We systematically mapped these variations into stable program families for better admission chance predictions:
Major Program Families:
- Computer_Science_Software
- Electrical_Electronics_ECE
- Mechanical_Industrial_Aero
- Civil_Construction_Env_Arch
- Bio_Biomed_Health_LifeSci
- Data_Science_AI_ML
- Business_Management
- Chemical_Materials_Petroleum
This grouping prevents data fragmentation while preserving meaningful distinctions between fields.
Admission Patterns and Data Balance
Our model learns from both successful and unsuccessful applications. Here's the year-by-year breakdown showing the dataset maintains realistic balance:
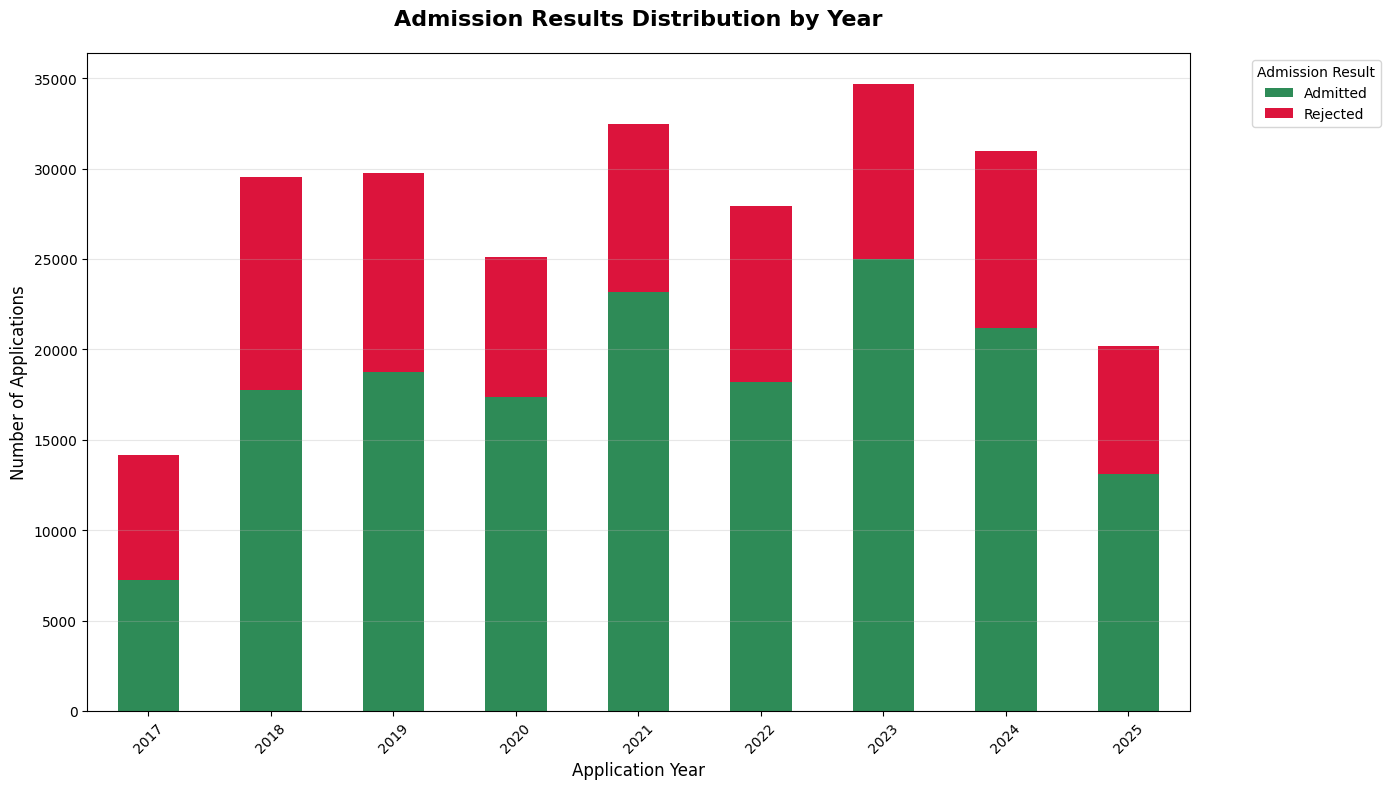
Recent Admission Rates:
- 2021: 71.3% (23,148 of 32,480 applications)
- 2022: 65.2% (18,194 of 27,907 applications)
- 2023: 72.1% (25,006 of 34,674 applications)
- 2024: 68.4% (21,155 of 30,949 applications)
- 2025: 64.8% (13,091 of 20,199 applications)
These rates appear higher than typical university-reported admission rates. This "positivity bias" occurs because applicants are more likely to share successful outcomes publicly than rejections. We're well aware of this reporting skew we handle this efficiently during training and prediction which you will see below.
Student Profile Diversity
The dataset represents diverse student backgrounds, preventing the model from overfitting to a single profile type:
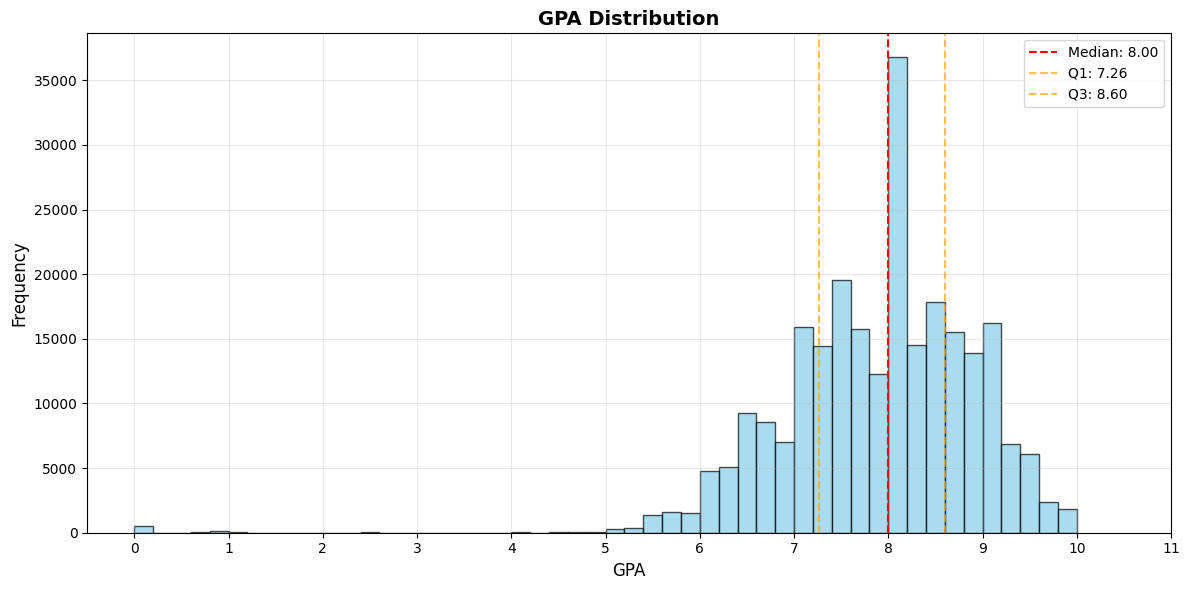
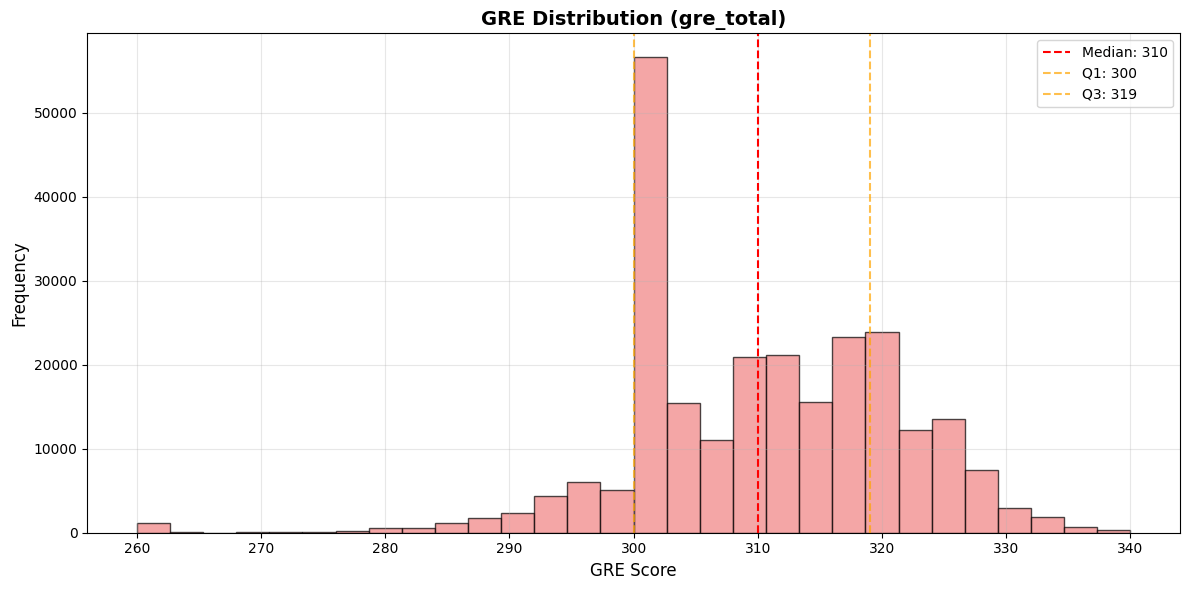
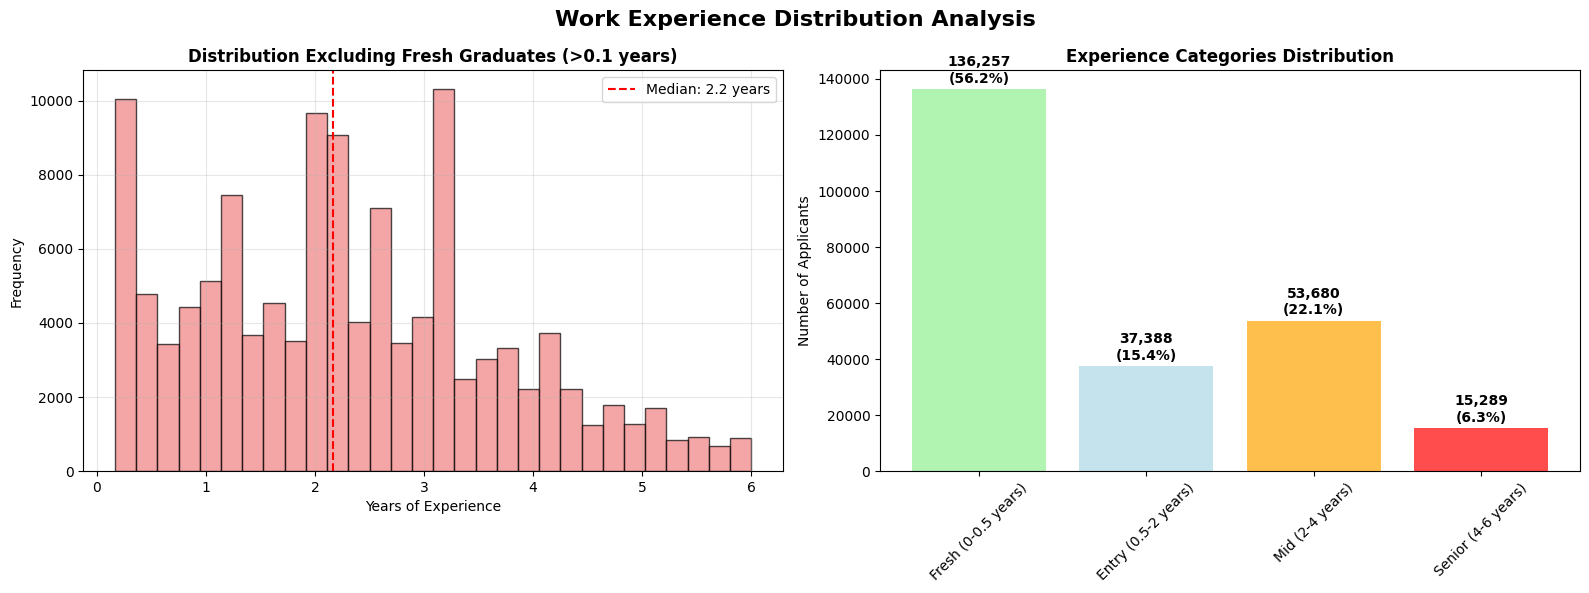
This diversity is crucial - it means our predictions work for both fresh graduates and experienced professionals, for students with varying academic backgrounds, and across different test score ranges.
Graduate School Admission Prediction Model Architecture and Training
After experimenting with multiple machine learning approaches, we settled on CatBoost as our core algorithm for predicting graduate school admission chances. Here's why this choice was critical:
Why CatBoost?
- Native Categorical Handling: Processes university names, program types, and other categorical features without manual encoding
- Gradient Boosting Power: Captures complex interaction patterns in admissions decisions
- Robust to Overfitting: Built-in regularization prevents memorizing specific university-student combinations
Training Methodology: We used rolling-origin validation to prevent data leakage. For each evaluation year from 2012-2024:
- Train on all historical data up to year N-1
- Validate on year N
- Measure performance using AUC and Brier score
Risk Buckets: Instead of raw probabilities, we group predictions into actionable categories:
- Reach (0-45%): Long shots worth applying to if you love the program
- Ambitious (45-70%): Competitive targets requiring strong applications
- Moderate (70-80%): Realistic options with solid chances
- Safe (80-88%): High confidence admits
- Very Safe (88%+): Near-certain acceptance
Handling Data Imbalance
Our data was admit-heavy, so the model was bound to give probabilities more towards 1 than 0, making traditional thresholds (like 50% for moderate chances) inappropriate. We carefully divided the buckets based on the brackets above and tested them on the 2025 dataset.
The calibration process involved:
- Analyzing the probability distribution of true admits vs. rejects
- Identifying meaningful threshold boundaries where probability shifts corresponded to real admission rate changes
- Testing different bucket thresholds against held-out 2025 data
- Measuring bucket accuracy - ensuring "Safe" applications resulted in admits at least 80% of the time
This recalibration ensures our risk categories reflect actual chances despite the inherent positivity bias in self-reported data. You can also see that the admit_rate rises as we move down in the buckets. Reach in the following graph means Very Ambitious.
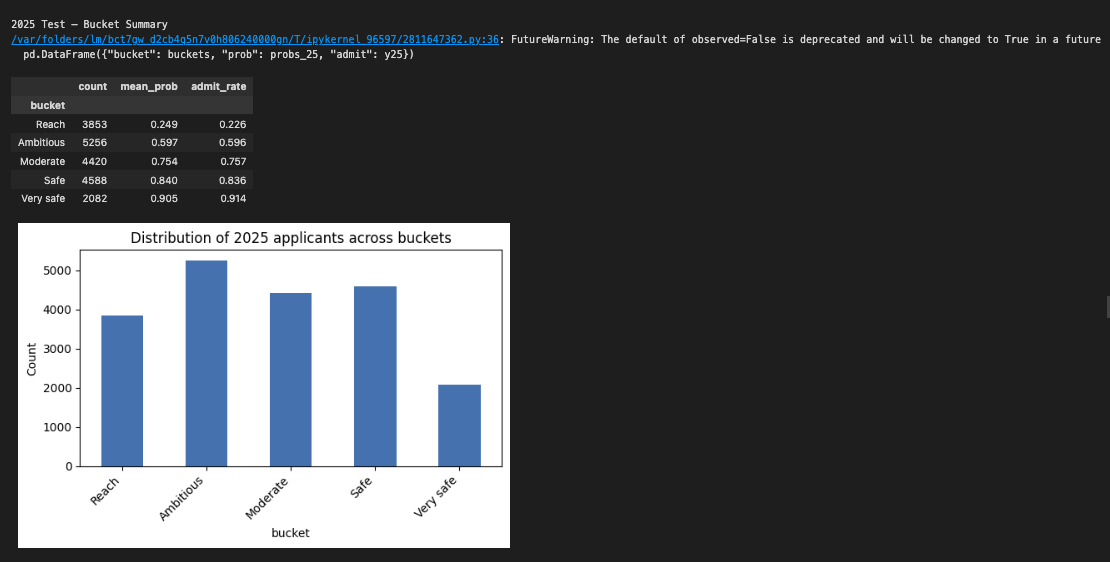
This bucketing system helps students build balanced application lists rather than getting lost in precise percentage differences.
Evidence-Based Recommendations
Model predictions are only part of the story. We also compute an evidence score that measures how much historical data supports each prediction:
Evidence Requirements:
- Minimum 25 similar profiles for the same university and program
- Profiles matched within tolerance bands (GRE ±5 points, GPA ±0.5 points)
- Recent data weighted more heavily than older records
- Course bucket alignment (CS students matched with CS programs)
Blended Scoring: Our final recommendations combine model probability with evidence strength:
Final Score = 0.5 × Model Probability + 0.5 × Evidence Rate
This prevents overconfident predictions for thin data segments while boosting confidence where we have abundant evidence.
What You See:
- Calibrated Probability: Model's prediction after probability calibration
- Evidence Indicator: Number of similar historical cases found
- Blended Rank: Combined score used for university ordering
- Explanations: Which factors helped or hurt your profile
Transparency and Limitations
What We Don't Do:
- Take commissions from universities (zero financial incentives)
- Hide thin evidence behind confident numbers
- Treat probabilities as guarantees
- Apply static models without monitoring for drift
What We Do:
- Show evidence quality for every prediction
- Validate performance on future time periods
- Provide clear explanations for each recommendation
Model Limitations:
- Predictions based on historical patterns, not admissions committee intentions
- Cannot account for factors not captured in applications (essays, interviews, timing)
- May not reflect sudden policy changes or extraordinary circumstances
- Works best for traditional applicant profiles within historical data ranges
Closing
We built this system because we were frustrated with opaque, biased admissions advice. Every prediction in our platform traces back to real students who shared their outcomes publicly. The scale gives us confidence in patterns. The methodology ensures fair treatment. The transparency lets you judge the quality yourself.
When planning your graduate applications, you deserve data-driven insights, not sales pitches. Sign up now to examine the evidence quality, check out our recommendations to discover programs that match your profile, or gain more insights through the blog on the graduate application process.